

Decks
Add a chart
Put a chart on a slide, pick its type, and change how it looks.
-
Open the deck and go to the slide.
-
Click the Chart button Chart in the toolbar.
-
Pick a chart type. The chart lands on the slide with sample numbers.
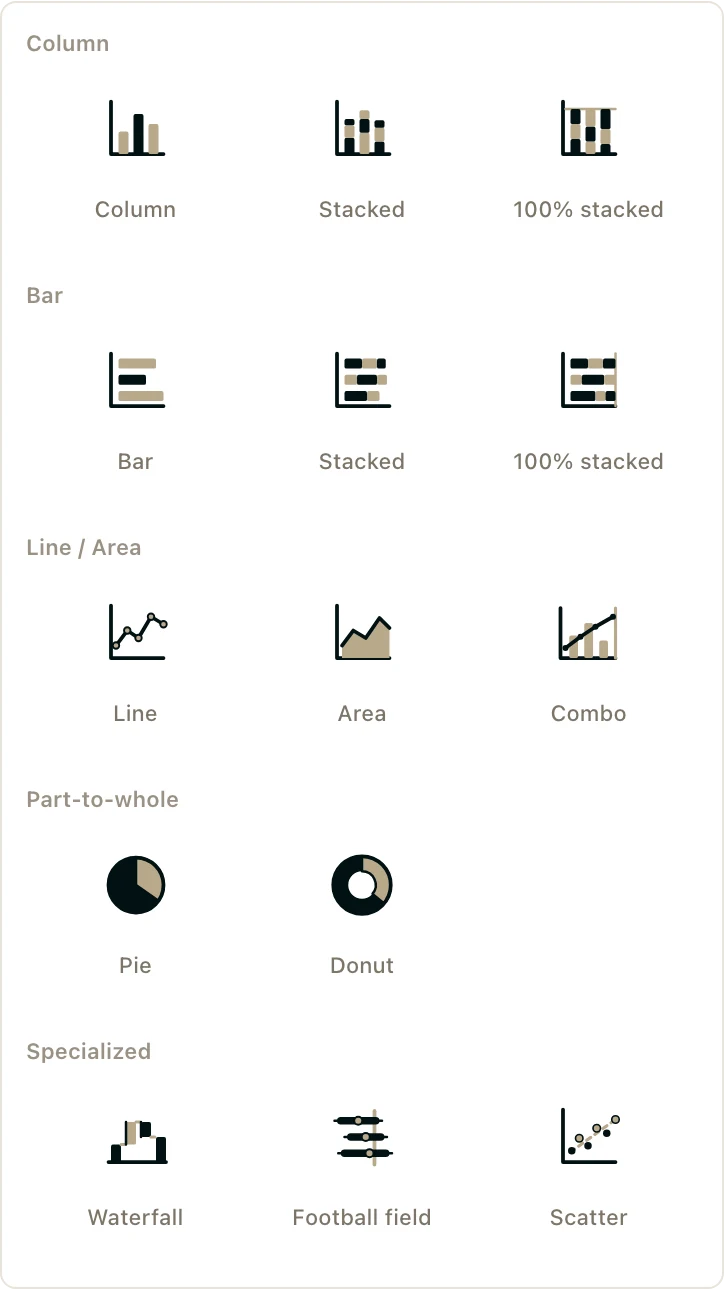
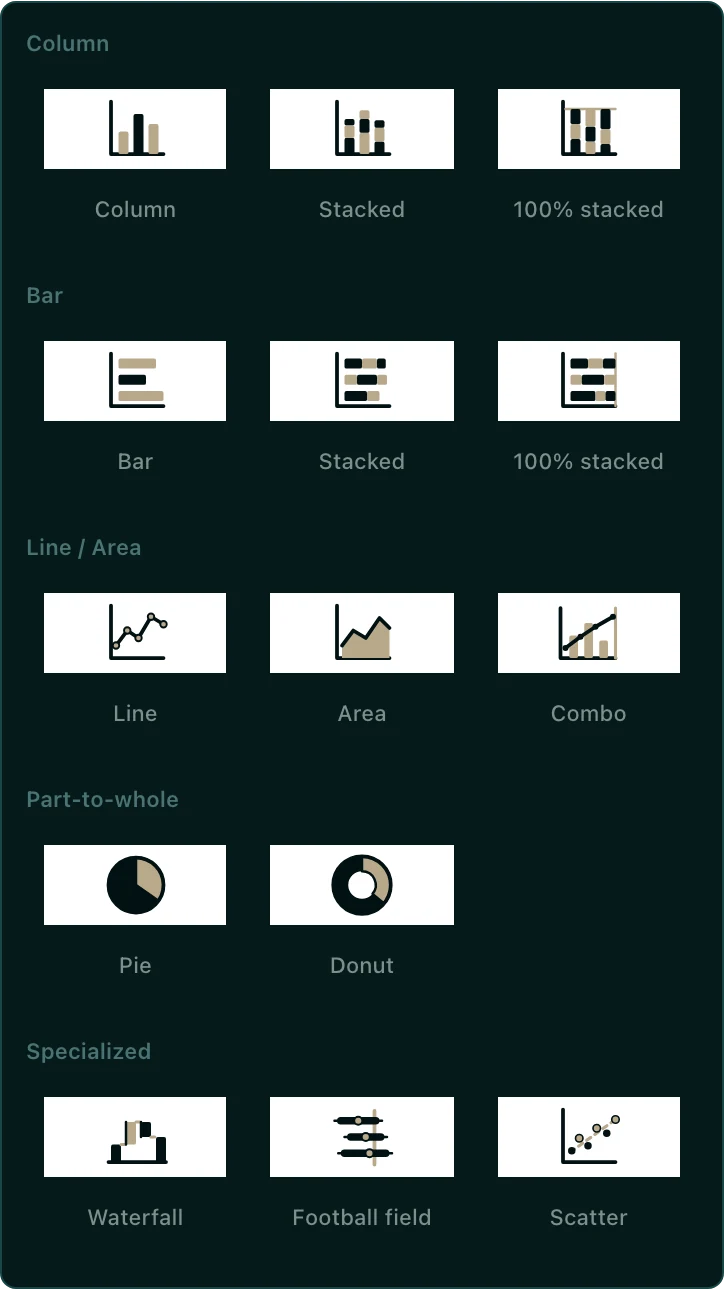
-
To put in your own numbers, see Edit a chart's data.
Which chart types are there?
| Group | Types |
|---|---|
| Column | Column, Stacked, 100% stacked |
| Bar | Bar, Stacked, 100% stacked |
| Line / Area | Line, Area, Combo (bars and lines together) |
| Part-to-whole | Pie, Donut |
| Specialized | Waterfall, Football field, Scatter |
A football field chart shows value ranges side by side, like a DCF range next to a comparable-companies range.
Change how a chart looks
- Double-click the chart. The Edit chart window opens with a live preview.
- To switch to another kind of chart, click the chart type at the top and pick a new one.
- Change what you need:
- Titles: the title, subtitle, and how they line up.
- Number format: a prefix like $, a suffix like M, decimals, and how negative numbers show.
- Legend: whether it shows, and where.
- Series: colors and data labels.
- Axes: axis settings and gridlines.
- Close the window. Your changes go onto the slide when it closes.
Some chart types show extra sections. For example, a football field chart has Bars and Reference line.
To switch chart type without opening the window, right-click the chart and choose Change chart type.
Good to know
- You need to be an Admin or Editor of the space to add or change charts. See Space roles.
- When you export the deck to PowerPoint, charts come through as pictures.